Kibana
This section will cover Kibana by Elastic.
Table of Contents
- Introduction
- Kibana Query Language
- Free Text Search
- Logical Operators
- Comparison Operators
- Wildcard and Regular Expressions
- Creating a Dashboard
Introduction
Kibana is an open-source visualisation dashboard that is part of the Elastic (ELK) stack. It can also be used as a SIEM.
https://www.elastic.co/kibana
Data from Elasticsearch is passed to Kibana which can be visualised and queried using either the Kibana Query Language (KQL) or Elastic Common Schema (ECS).
Kibana Query Language
The Kibana Query Language (KQL) is a user-friendly query language that is designed specifically for searching and analysing data in Kibana.
https://www.elastic.co/guide/en/kibana/current/kuery-query.html
It basic syntax uses a field:value pair where the field is the data attribute and the value is the value associated with it.
event.code:4625
The above example will search for the event.code with a value of 4625. This is the value for failed login attempts on Windows.
Free Text Search
It is also possible to search for a specific term across multiple fields without specifying a field name using free text search.
"svc-sql"
The above query will return any records with svc-sql in any indexed field.
Logical Operators
Logical operators such as AND, OR, and NOT can be used. Parentheses can be used to group expressions and control the order of the evaluation for more complex searches.
event.code:4625 AND winlog.event_data.SubStatus:0xC0000072
The above query will return any logs with the event code of 4625 (failed login attempts) with the sub status of 0xC0000072 (account disabled).
Comparison Operators
Comparison operators such as equal to (: or =), greater than (>), lesser than (<), lesser than or equal to (<=), greater than or equal to (>=), and not equal to != can be used.
event.code:4265 AND winlog.event_data.SubStatus:0xC0000072 AND @timestamp >= "2023-03-03T00:00:00.000Z" AND @timestamp <= "2023-03-06T23:59:59.999Z"
The above query will return failed logins attempts on windows with the account disabled sub status between the date and time (HH:MM:SS.sss) 2024-03-03 00:00:00.000 and 2023-03-06 23:59:59.999.
Wildcard and Regular Expressions
Wildcards and regular expressions can be used for patterns in field values.
event.code:4625 AND user.name: admin*
The above query will display any failed login attempts with any account that starts with admin such as, administrator, admin, admin123, etc.
Creating a Dashboard
Creating dashboards allows us to display and organise data in a meaningful way. This section will create a dashboard to display failed login attempts on Windows as an example.
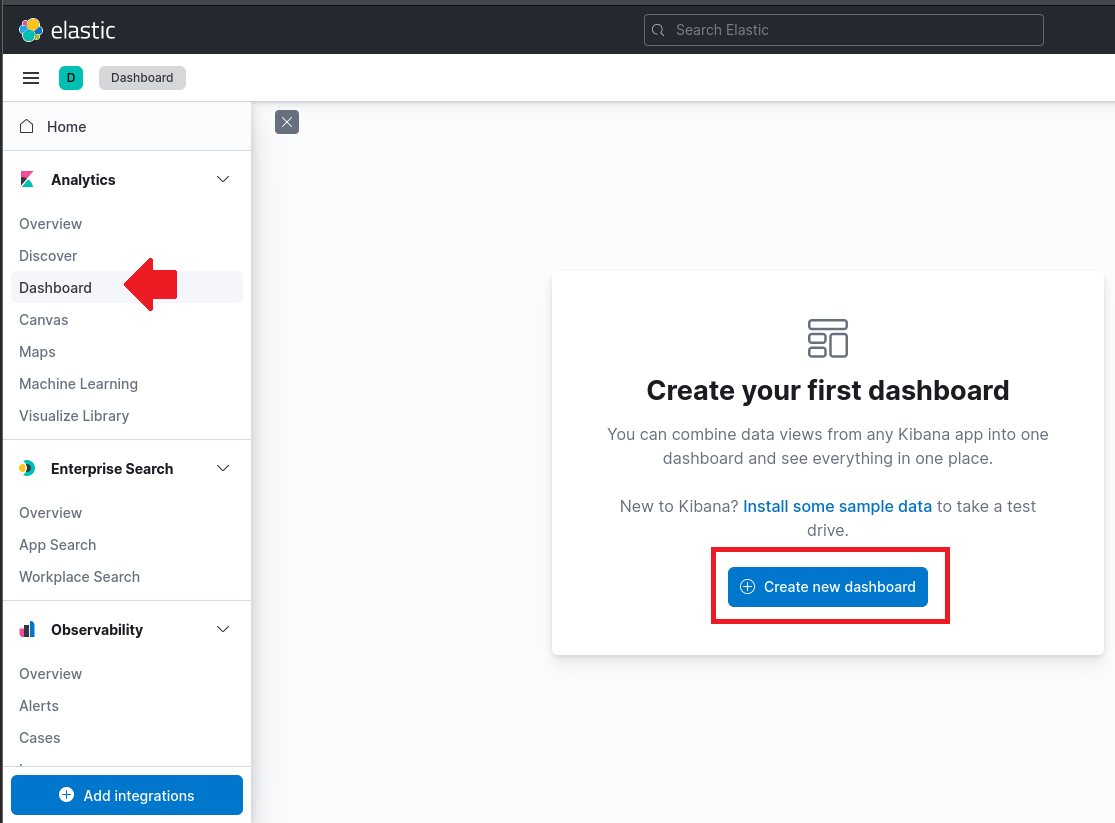
To start, navigate to Kibana and login. Once logged in, navigate to "Dashboard" and click "Create new dashboard".
Next, click on "Create visualization" and set the calendar on the top right to a time that covers your logs date such as 15 years. This example will create a dashboard for failed login attempts in Windows. We will be using the event.code with a value of 4625 filter.
To add a filter, click "Add filter" on the top left and input the following information.
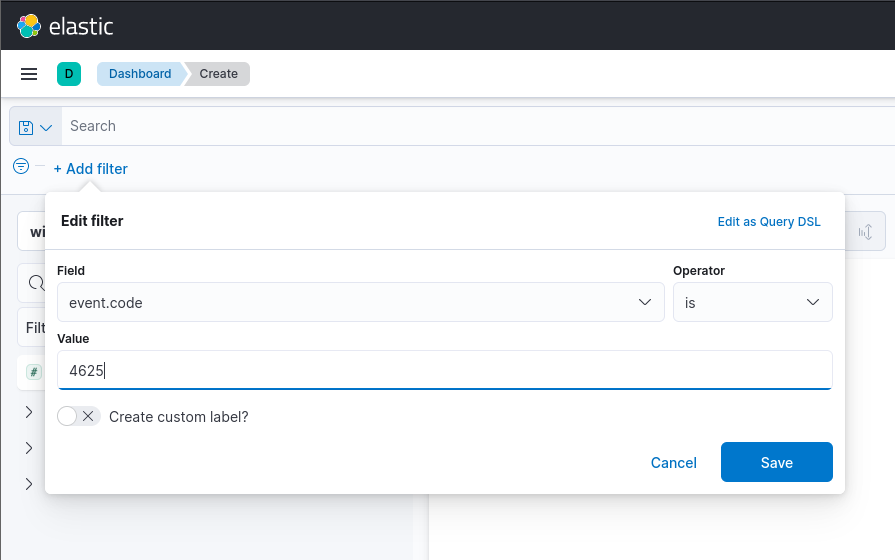
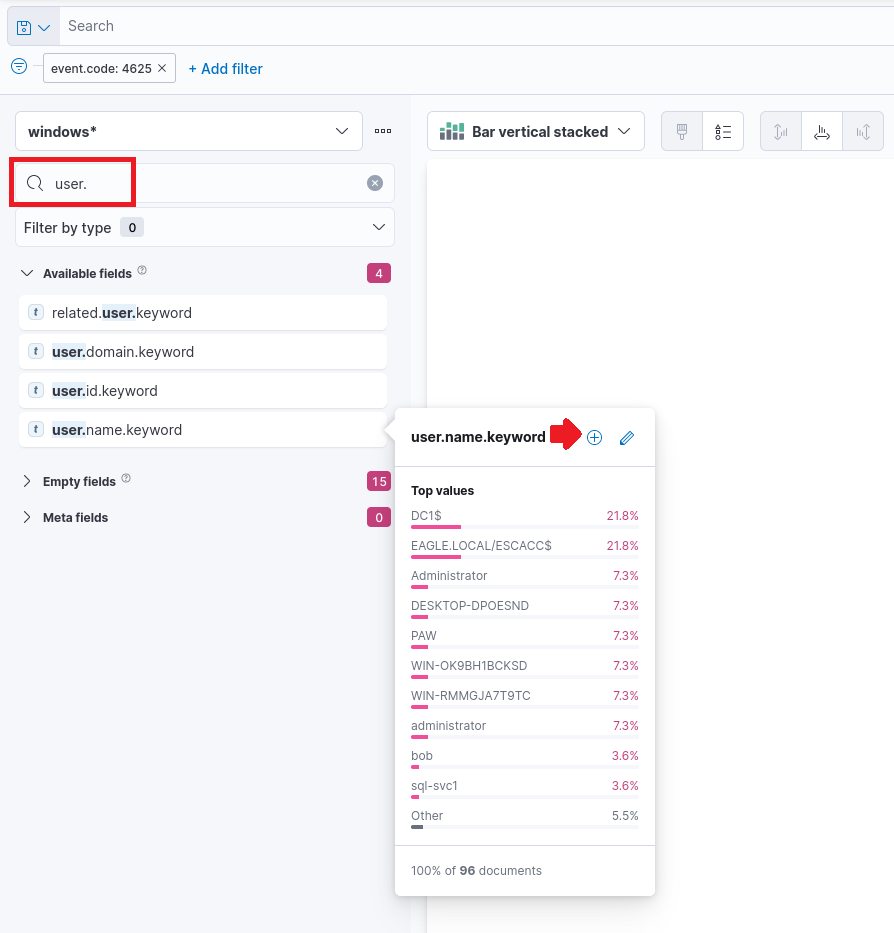
Once done, click save. On the index pattern, ensure it is using windows*. We will also add the user.name.keyword fields to the dashboard by searching for it and clicking the plus "+" icon. This will display the top usernames on the dashboard.
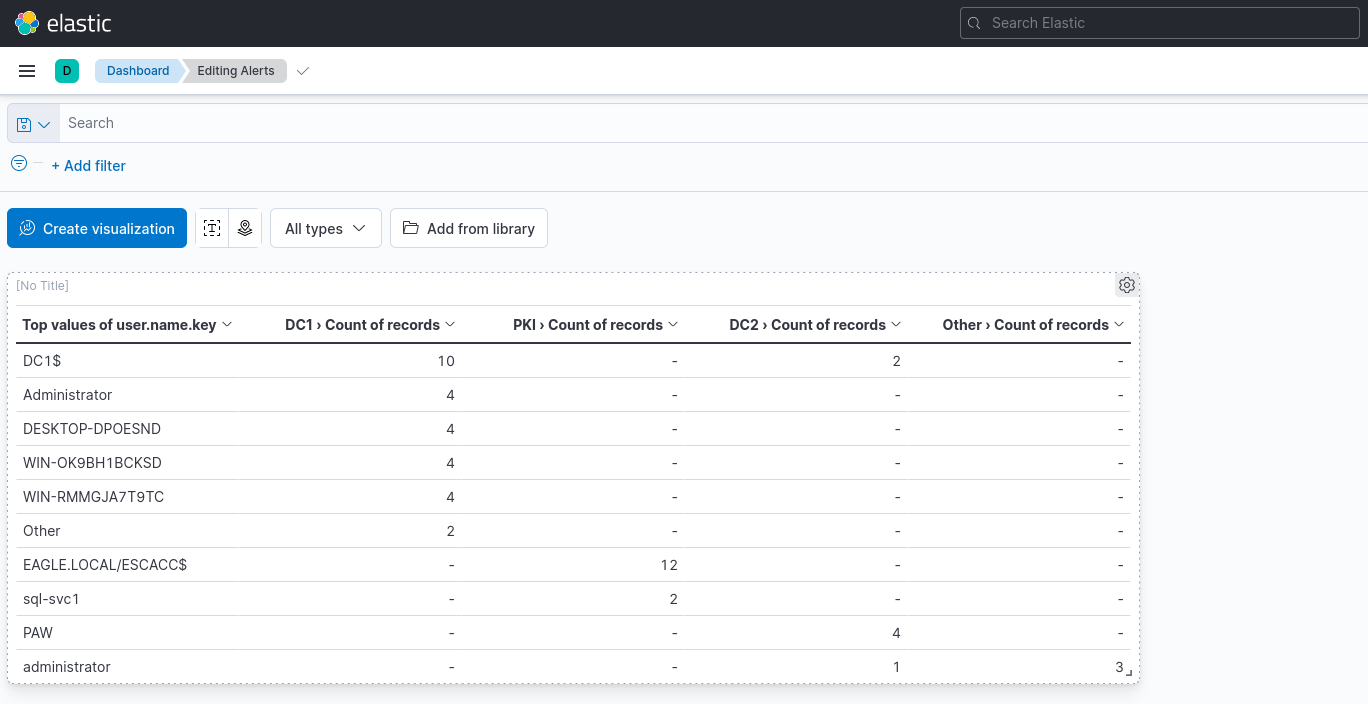
Once done, we can design how our dashboard will display the data. In this example, we will be using the table format with the user.name.keyword and the row with a value of 1000.

We can also add additional columns by selecting the "Columns" and adding a field. This example will use host.name.keyword.

Once done, we can click "Save and return" on the top right to save the dashboard.
If we want to refine or edit the dashboard, simply click the gear icon and select "Edit lens".
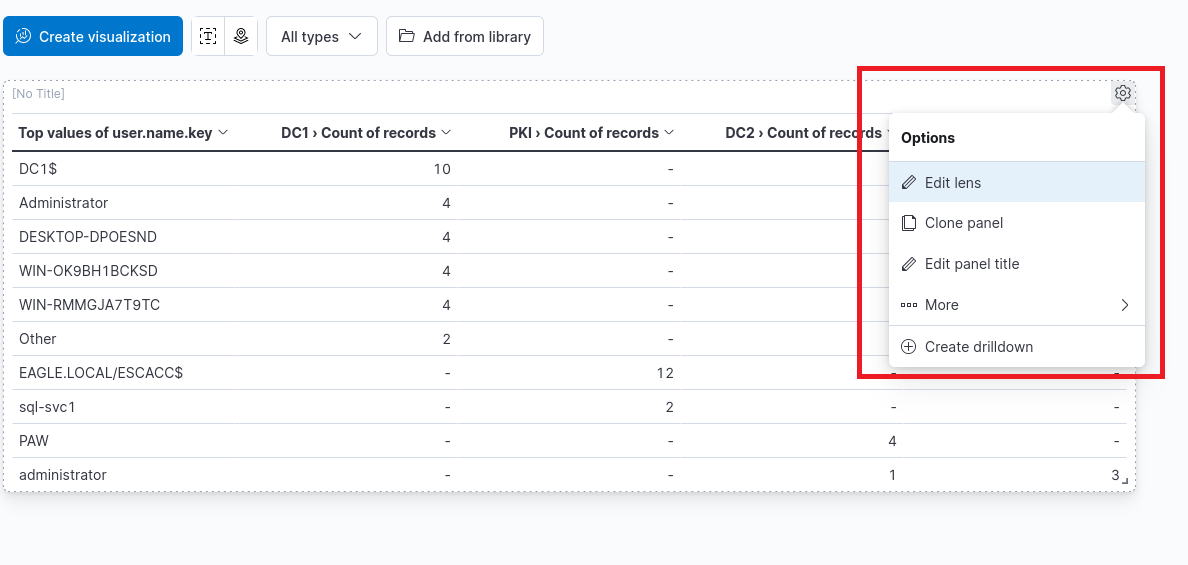
There are a lot of different ways to customise the dashboard. Once done, simply repeat the same process to save the dashboard. One way of improving the above dashboard is by having more meaningful names to the columns.
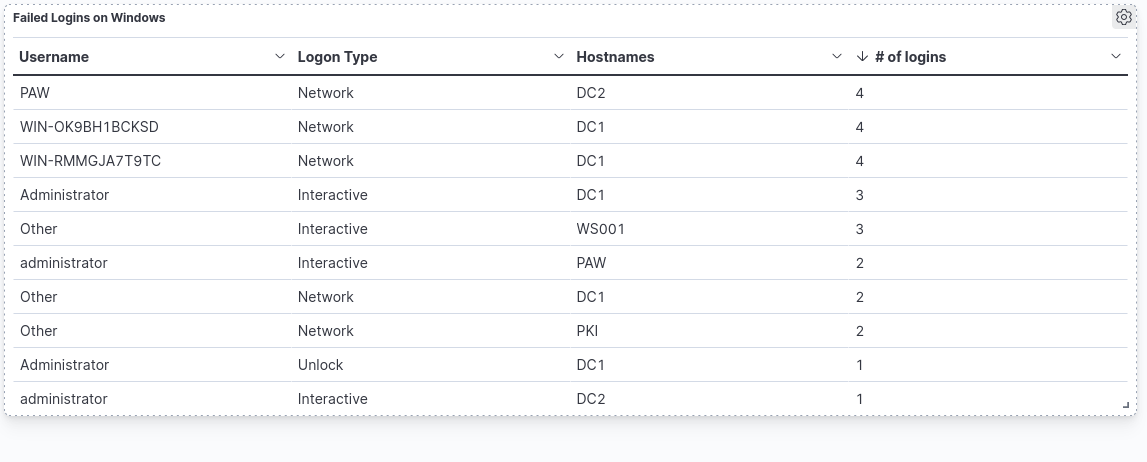
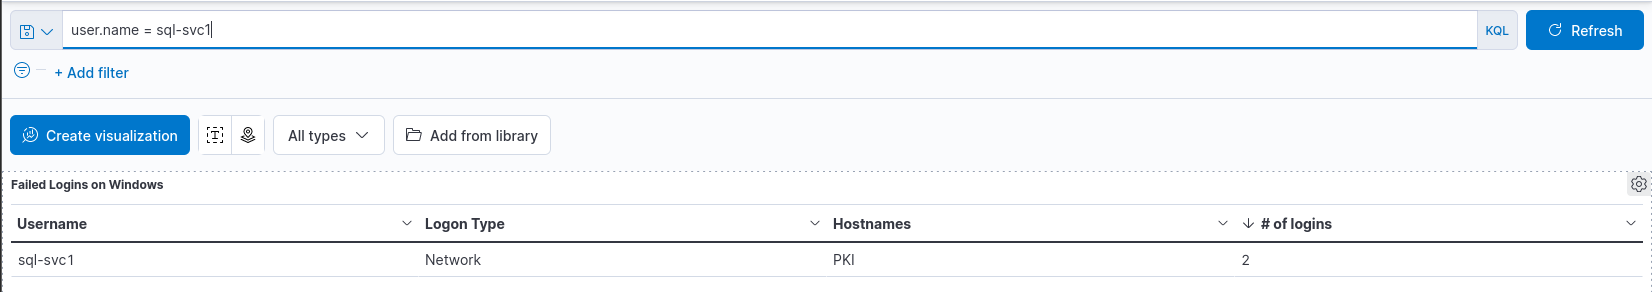
The filters and KQL can be used to filter the results accordingly. An example is excluding certain usernames or by searching for a specific username.